Interpreting data read-outs is a skill, and for those new to it, it can be daunting. Here DSN Peter Jennings* talks us through viewing a FreeStyle Libre download.
Peter Jennings is a T1D and DSN. These days he spends four days as an academic and one day at clinic and says, “I’ve always seen my role is being that as a teacher and facilitator, not a dictator. The way I see it, I’m just here to walk alongside you, so when I look at your data, it’s not a judgment of ‘good’ or ‘bad’ based on your readings, it’s simply a conversation about them. I might ask, what might we alter here in order to change the outcome? I really don’t want people to beat themselves up when their data downloads are not perfect, they may never be, and it’s a hard disease to live with.
“I like to approach these downloads with a sense of curiosity, wondering, ‘what’s going on here?’. It’s important to start with the basics, to check your bases – what were you aiming for? The patient and myself need to understand what you’re trying to achieve. That helps us to understand whether or not we’re getting anywhere close to our goals.
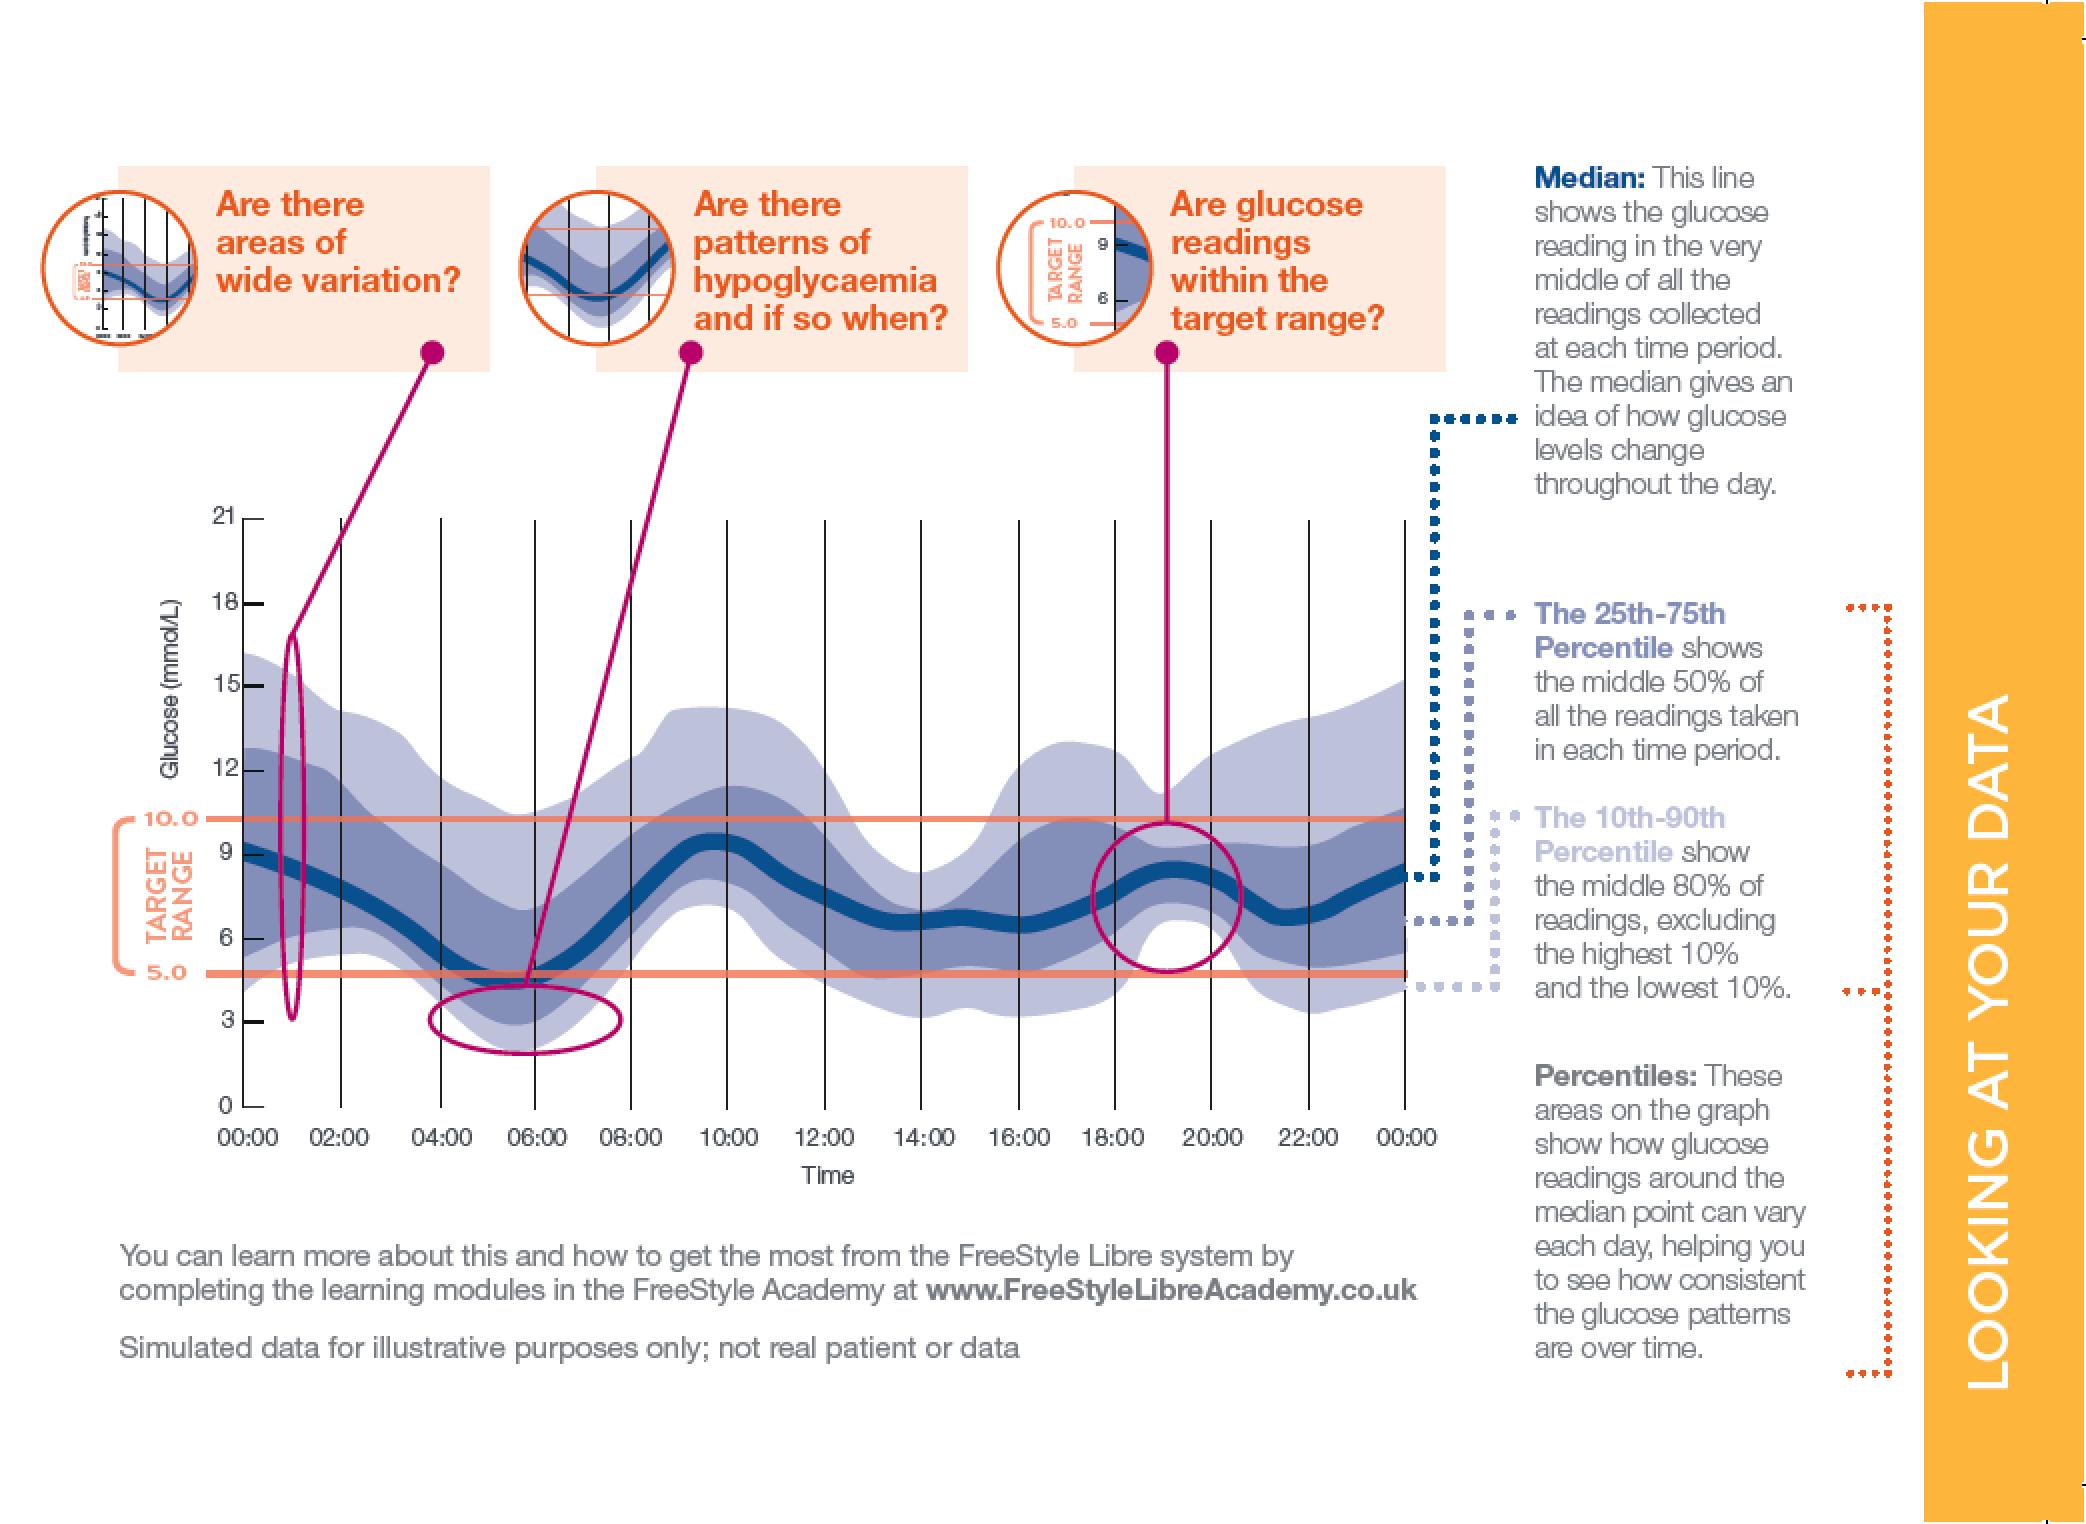
“The kind of screenshot illustrated here is typical of data produced over a 24-hour period. Not surprisingly, the actual range of results across a full day can be quite wide. That means that if your target range had been 4-7mmols/l you will also see quite a bit of time spent between 5-10mmol/l. Glucose fluctuation is normal in anyone with Type I diabetes, but they may not have seen it presented in this way before. It’s very important not to be put off.
“With Abbott’s Freestyle Libre sensor, the data download is called an ambulatory glucose profile (AGP). In other words, it is giving all your data in one visual representation. The darkest blue line is the median. There are two more bands of blue – the slightly darker shade shows where 25% to 75% of the readings fall, that is to say 50% of your readings. It’s called the 25-75 percentile The lighter blue shaded area shows 80% of readings, and is called the 10th-90th percentile. It excludes the 10% highest and 10% lowest readings.”
Shades of blue
Looking at this data download, Jennings explains, “The majority of the readings are shown within the pale blue shaded area, and from this you can begin to patterns looking beyond individual results. Looking back at the image, one aspect to consider is how wide the shaded area is. That gives us an insight. The dark blue line, the median, stays roughly the same size (or depth). The others can change a little bit depending on the time of day the tests are being taken.
“For example, at 6am in the darker shade of blue most of the results are in quite a tight area, between 6.5-7 mmol. As many as 50% of the readings are falling in that area, which is pretty good for that time in the morning. It’s a nice safe start to the day. However, some of these tests are coming in a little low – down as far as 3mmols/l, which isn’t quite so great so that might need looking at. No one likes waking up with a hypo.
“Looking at 10am, the lighter area shows that the range of results is a bit wider. But by 2pm, there is less variation so the bands there are not so wide. Moving on to 4pm though and the band has become wider again, showing a bit more variability which lasting through to 6pm. In this example, there is the most variation being shown from 8pm to midnight. It’s to see more variability in the evening when people eat, relax, they might go out, they might sit at home in front of the telly, therefore you get a much wider variation in that period but it’s still a normal range of variation for what they are doing.
Little tweaks
Working in tandem with his diabetes patients, these downloads are a useful tool for exploring aspects of control. Jennings says, “When I’m with the patient we may just discuss their results and not necessarily tweak much. I prefer to encourage people to make just one change at a time in order to improve control as well as improve understanding. Looking at the dark blue line, the median, might help us make changes to insulin doses because if the line shows a downward trend afterwards then you might be taking too much.
“With this kind of data downloads, as well as checking the reader’s screen throughout the day, can help with behaviours, such as overreacting to a high blood sugar. You might see that if you take insulin at mealtime it then has to play catch up with your food absorption, so seeing your blood sugar will be high an hour later. Often people put in a correction dose at that point, but that would be too much insulin and tip you over into hypo. It’s easily done in a busy life, but the data can help identify this as an over reaction. Just wait and there may not be a need for the correction dose.
“Before using something like a Libre sensor a patient might be asked to aim for an HbA1c of 8%, which may be difficult to achieve, but within reason. Using Libre it can help map out and fine-tune your control and the aim could then be to get to 7.5%.
“In my experience different people use this kind of data in different ways. People do really like the Libre technology. It costs roughly £3.50 a day to use it if you’re self funding, which is more or less the cost of one coffee a day. Most people would consider that a worthwhile investment to improve control. Arguably, self-funders who put the money up for this themselves, are more motivated people in the first place. I’ve found most people like using the hourly trend alerts as well as looking at the 24-hour reviews and the daily averages section on the reader. It’s great to be able to see sugars in time blocks. You could just tighten up on the high ones. Nice little nudges like that can see good improvements over time.”
Back it up
Jennings has been on an insulin pump a long time and for a while worked for Medtronic. Now a DSN with Derby Hospitals, he now sees a lot of people on pumps and sensors. “One thing I have learned personally, and I always point out to my patients, is that technology can fail. Never totally trust the technology. If it’s not telling you completely what you expect then check that it’s working properly. And be prepared: carry a backup with you at all times, spare insulin and even disposable syringes. Is not sexy, but if your pump packs up then just having insulin and a means of delivery it can buy yourself time before you can sort out the technical problem. You almost need a pump fail to see how you can get caught out.”
In addition, Jennings says that it’s not all about technology. “For the newly diagnosed and those new to pumps I give out paper diaries, these really help people to make that link between their blood test results, their insulin dose and the food they have eaten. I also encourage people to be mindful of daily blood tests too. They are the bedrock of diabetes care. But I also help the people I see to navigate the choice and selection of diabetes technology. We try to figure out what is best for them and is it assisting, otherwise there’s no point in having it.”
*Peter Jennings works as a Senior Lecturer at Nottingham Trent University (NTU) and as a Diabetes Specialist Nurse (DSN) at the University Hospitals of Derby and Burton. He specialises in educating people with diabetes about Technologies for Type 1 Diabetes such as Flash Glucose Monitoring and Insulin Pump Therapy. Peter also provides training and support to healthcare professionals about how technologies can help to alleviate the burden of living with diabetes. He can be reached via email at peter.jennings@ntu.ac.uk or Twitter @peterjjennings1.
News items and features like this appear in the Desang Diabetes Magazine, our free-to-receive digital journal (see below). We cover diabetes news, diabetes management equipment (diabetes ‘kit’ such as insulin pumps and continuous glucose monitoring equipment) and news about food suitable for a diabetic diet including a regular Making Carbs Count column. We just need your email address to subscribe you (it’s free, and you can easily unsubscribe should you wish to).